A Journey Through Time: Tracing the History of Renewable Energy in the United States
The tale of renewable energy in the United States is a long and winding one, marked by periods of innovation, decline, and resurgence.
Let's take a trip down memory lane to explore this dynamic story:
Early Beginnings (Before 1800s):
- Wood Power: For millennia, wood remained the primary source of energy for heating, cooking, and lighting. Its abundance and ease of access made it the go-to fuel for early Americans.
- Water Power: Harnessing the power of flowing water for grinding grain and powering small mills started appearing as early as the 17th century.
The Rise of Hydropower (1800s - Early 1900s):
- Industrial Revolution: The 19th century saw a surge in industrialization, demanding greater energy needs. Hydropower emerged as a powerful solution, with the first commercial hydroelectric plant opening in Appleton, Wisconsin, in 1882.
- Dam Construction Boom: Large-scale dam projects like Hoover Dam in the 1930s further cemented hydropower's dominance as the leading renewable energy source.
Shifting Landscapes (Early 1900s - Mid 20th Century):
- Fossil Fuel Era: Discovery of vast oil and natural gas reserves, coupled with technological advancements, led to a shift towards these cheaper and readily available fossil fuels. Renewable energy gradually receded into the background.
- Wood's Resurgence: World War I and II, with their constraints on fossil fuels, saw a temporary return to wood as a heating source.
Environmental Awakening (Mid 20th Century - Present):
- Renewed Interest: Growing concerns about environmental damage and limited fossil fuel resources sparked a renewed interest in renewable energy sources in the 1970s.
- Policy Push: The oil crisis of the 1970s further propelled policy changes encouraging renewable energy development. The Carter administration invested in solar and wind research, laying the groundwork for future advancements.
- Tech Advancements: Technological innovations, particularly in solar panels and wind turbines, drastically reduced their costs, making them more competitive with fossil fuels.
- Continued Growth: Today, renewable energy sources like solar, wind, and geothermal are witnessing significant growth, driven by supportive policies, falling costs, and public demand for clean energy.
Key Milestones:
- 1978: The Public Utility Regulatory Policies Act (PURPA) encourages renewable energy development by requiring utilities to buy surplus electricity from small producers.
- 1992: The Energy Policy Act of 1992 incentivizes renewable energy projects with tax credits and grants.
- 2005: The Renewable Portfolio Standards (RPS) require states to increase their reliance on renewable energy sources.
- 2011: Renewable energy surpasses nuclear power for the first time in the United States.
- 2022: The Inflation Reduction Act provides substantial funding for renewable energy development, transmission, and storage.
Looking Ahead:
The future of renewable energy in the United States is bright. With continued investment, technological advancements, and supportive policies, renewable sources are poised to play an increasingly crucial role in meeting the nation's energy needs while creating a cleaner and more sustainable future.
Renewable Energy Consumption in the United States
Here's a breakdown of renewable energy consumption in the US, incorporating insights from recent data and addressing potential confusion:
Overall:
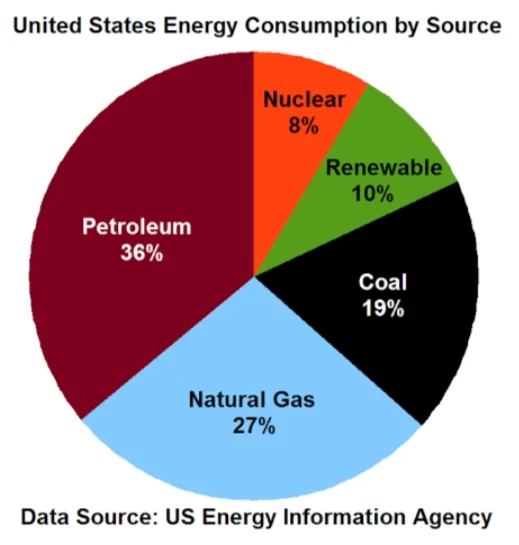
- In 2022, renewable energy accounted for 13.18 quadrillion British thermal units (Btu) of total energy consumption, or 13% of the national energy use.
- This figure includes renewable sources like hydropower, wind, solar, geothermal, biomass, and biofuels.
- Notably, hydropower makes up the largest share of renewable consumption, contributing approximately 37% of the total.
- However, solar and wind are experiencing the fastest growth, with their combined contribution reaching 33% in 2022.
Consumption vs. Production:
- It's crucial to differentiate between consumption and production. While 13% represents consumption, renewable energy production in the US reached 13.40 quads, or 13% of total production, in 2022.
Specific Sources:
Here's a breakdown of specific renewable energy sources' consumption based on 2022 data:
- Hydropower: 4.90 quads (37%)
- Biomass: 3.02 quads (23%)
- Wind: 1.62 quads (12%)
- Solar: 1.43 quads (11%)
- Biofuels: 1.34 quads (10%)
- Geothermal: 0.87 quads (7%)
Growth and Future Outlook:
- Renewable energy consumption has been steadily increasing in the US, with a significant jump from 9.9% in 2021 to 13% in 2022.
- Factors like the Inflation Reduction Act of 2022 and continued technological advancements are expected to accelerate this growth in the coming years.
- Experts predict that renewable energy consumption could reach 28% of total energy use by 2050.
Breakdown Data of Renewable Energy in the United States
Production (2022):
| Source | Energy Production (Trillion Btu) | Percentage of Total Renewable Production |
|---|---|---|
| Hydropower | 8.13 | 61.3% |
| Wind | 13.30 | 29.8% |
| Solar | 3.99 | 7.5% |
| Biomass | 2.00 | 1.4% |
| Geothermal | 0.01 | 0.0% |
| Total Renewables | 17.43 | 13.4% |
Consumption (2022):
| Source | Energy Consumption (Trillion Btu) | Percentage of Total Renewable Consumption |
|---|---|---|
| Hydropower | 7.85 | 58.5% |
| Wind | 5.92 | 43.9% |
| Solar | 1.29 | 9.6% |
| Biomass (Biofuels & Electricity) | 4.42 | 32.8% |
| Geothermal | 0.03 | 0.2% |
| Total Renewables | 19.51 | 15.0% |
Additional Breakdown:
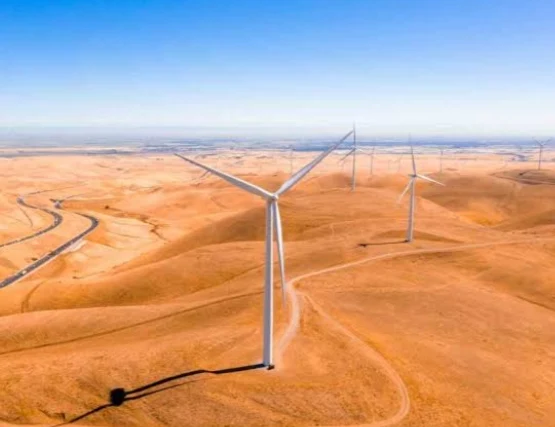
- Wind: Texas, Oklahoma, and Iowa are the top three states for wind energy production.
- Solar: California, Texas, and Florida are the top three states for solar energy production.
- Biomass: Biofuels (mainly for transportation) account for roughly half of biomass consumption, while the other half comes from biomass electricity generation.
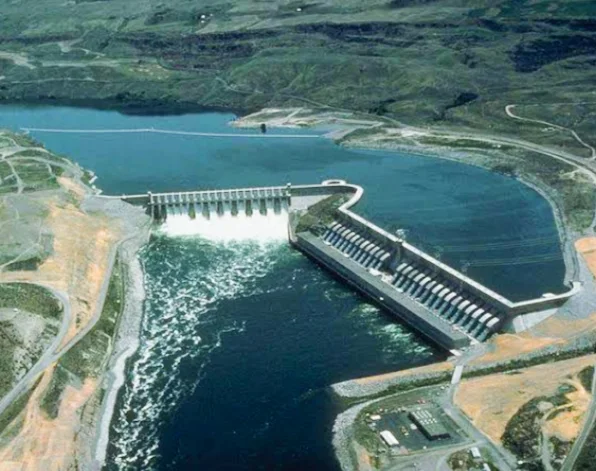
- Hydropower: The majority of hydropower production comes from large dams, especially in the West and Pacific Northwest.
Sources:
- U.S. Energy Information Administration (EIA): https://www.eia.gov/tools/faqs/faq.php?id=92&t=4
- EIA Monthly Energy Review: https://www.eia.gov/mer/
Hydropower Statistics in the United States
Production:
- 2022: Hydropower accounted for 6.2% of total U.S. utility-scale electricity generation and 28.7% of total utility-scale renewable electricity generation.
- Energy generation:
- 262 billion kilowatthours (kWh) in 2022 (13.4% of renewable production, 61.3% of hydro production)
- Highest recorded annual generation was in 2011 (812 billion kWh)
- Capacity:
- 102 gigawatts (GW) as of 2022, primarily from large dams.
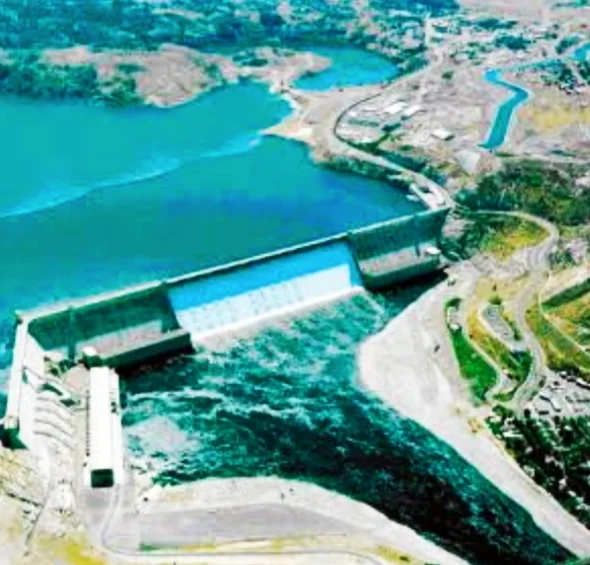
- Largest facility: Grand Coulee Dam (Washington) with 6,765 MW capacity.
Consumption:
- 2022: Consumed 7.85 trillion Btu (equivalent to 230 TWh).
- Source:
- Conventional Hydropower: 99.8%
- Pumped Storage Hydropower: 0.2%
Distribution:
- Top 5 Hydropower-Producing States:
- Washington
- California
- Oregon
- Tennessee
- Alabama
- Regional Breakdown:
- West: 62% of national capacity
- Southeast: 22%
- Northeast: 9%
- Midwest: 7%
Environmental Impact:
- Positive: Clean energy source, low greenhouse gas emissions.
- Negative: Dams can harm ecosystems and fisheries, displace communities.
Additional Notes:
- Hydropower development has slowed down in recent years due to environmental concerns and competition from other renewable sources.
- Pumped storage hydropower plays a critical role in grid management by storing and releasing energy when needed.
- The future of hydropower in the US is uncertain, but it is likely to remain an important source of clean energy.
Wind Energy Statistics in the United States
Here's a summary of some key statistics on wind energy in the US, as of 2023/early 2024:
Generation:
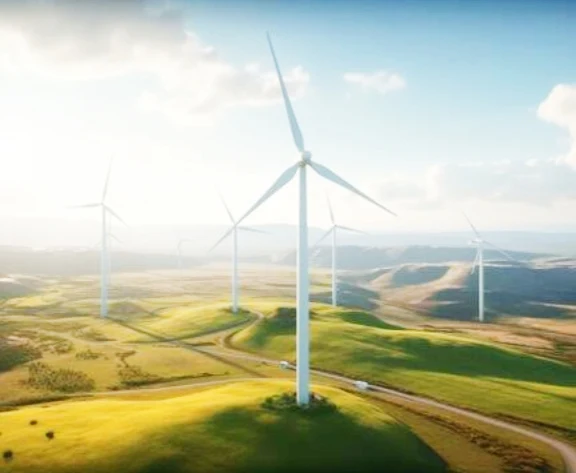
- Electricity: In 2022, wind power generated 434.8 terawatt hours of electricity, making it the main source of renewable energy in the US, surpassing hydropower. (Source: Statista)
- Growth: Since 2000, wind electricity generation has increased significantly, from 6 billion kWh to 380 billion kWh in 2021. In 2022, it accounted for 10.2% of total US utility-scale electricity generation. (Source: EIA)
Capacity and Infrastructure:
- Installed capacity: As of 2023, the US has a total wind power capacity of 146 gigawatts (GW), enough to power 46 million American homes. This makes it the fourth-largest source of electricity generation capacity in the country. (Source: Clean Power Alliance)
- Turbines: Over 70,000 wind turbines are currently operating across all 50 states. (Source: Clean Power Alliance)
Economic Impact:
- Jobs: In 2020, the wind industry supported over 120,000 jobs in the US. (Source: Clean Power Alliance)
- Investments: Renewable energy investments, including wind, rose to $105 billion in 2021, a 7% increase from the previous year. (Source: Statista)
- Environmental benefits: Wind energy avoided 336 million metric tons of CO2 emissions in 2022. (Source: Clean Power Alliance)
Solar Energy Statistics in the United States
Here's a summary of some key statistics on solar energy in the US, as of 2023/early 2024:
Generation:
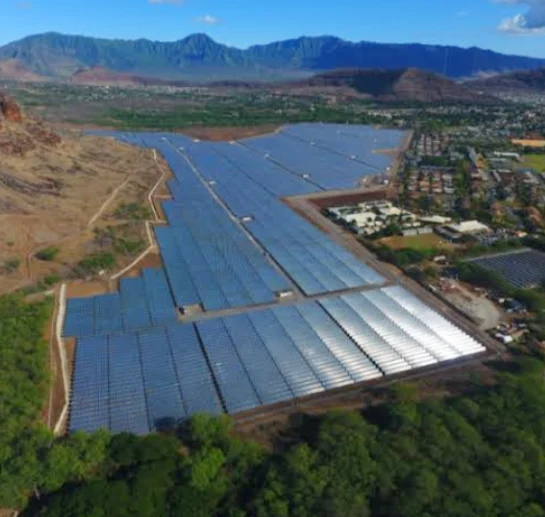
- Electricity: In 2022, solar power generated 145.6 terawatt hours of electricity, representing 3.4% of the total and 15.9% of renewable energy production. (Source: Statista, EcoWatch)
- Growth: Solar electricity generation has seen rapid growth, experiencing an average annual increase of 24% in the last decade. (Source: Statista)
Capacity and Infrastructure:
- Installed capacity: As of 2022, the US has a total solar power capacity of 110 gigawatts (GW), enough to power 37 million American homes. (Source: Statista)
- Systems: Over 3 million solar photovoltaic (PV) systems are installed across the US, with residential installations growing at a record pace in 2022. (Source: SEIA)
Economic Impact:
- Jobs: The solar industry employed over 346,000 workers in 2022, and the workforce grew by 3.7% from the previous year. (Source: EcoWatch)
- Investments: Private investments in the solar industry reached $36 billion in 2022. (Source: SEIA)
- Environmental benefits: Solar energy avoided 84 million metric tons of CO2 emissions in 2022. (Source: SEIA)
Biomass Energy Statistics in the United States
Here's some key data on biomass energy in the US as of February 19, 2024:
Overall Contribution:
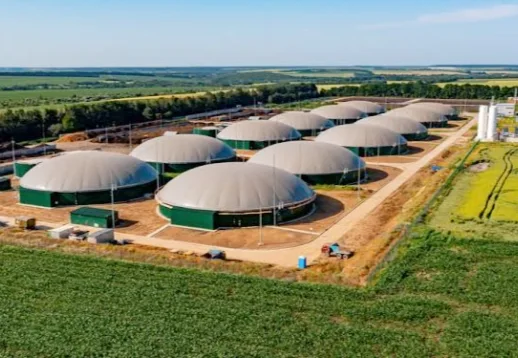
- Share of total energy consumption: 5% in 2022 (4,930 trillion British thermal units, TBtu)
- Largest source before mid-1800s.
Sources of Biomass Energy:
- Biofuels (49%):
- Ethanol production: 15.4 billion gallons in 2022
- Biodiesel/renewable diesel production: 3.1 billion gallons in 2022
- Wood and wood waste (43%):
- Net electricity generation: 39.9 gigawatt hours in 2019 (3rd largest non-hydroelectric renewable source)
- Densified biomass fuel production capacity: 12.96 million tons per year (as of November 2023)
- Waste energy (8%)
Geothermal Energy Statistics in the United States
Here's some key data on geothermal energy in the US as of February 19, 2024:
Overall Contribution:
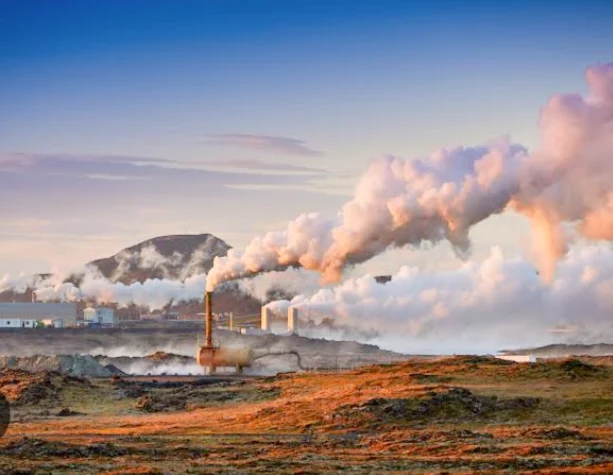
- Share of total electricity generation: 0.4% in 2022 (17 billion kilowatthours)
- Ranked 5th among renewable energy sources in the US.
Capacity and Production:
- Installed geothermal capacity: 2,653 megawatts (MW) as of 2022, leading the world.
- Geothermal electricity generation: 214 trillion British thermal units (Btu) of renewable energy consumed in 2022.
- California: holds the top spot with 2,792 MW installed capacity, followed by Nevada with 805 MW.
Additional Notes:
- Geothermal energy also finds applications beyond electricity generation, including direct heating for buildings, greenhouses, and industrial processes.
- Despite its potential, geothermal energy faces challenges like upfront costs, limited geographical suitability, and permitting hurdles.
Top 10 Largest Renewable Energy Infrastructures in the United States by Capacity
Here's a table summarizing the Largest Renewable Energy Infrastructures in the United States by Capacity
| Rank | Infrastructure Name | Type | Capacity (Gigawatts) | State(s) | Owner(s) |
|---|---|---|---|---|---|
| 1 | Grand Coulee Dam Hydroelectric Project | Hydroelectric | 7.26 | Washington | U.S. Bureau of Reclamation |
| 2 | Hoover Dam Hydroelectric Project | Hydroelectric | 2.08 | Arizona & Nevada | U.S. Bureau of Reclamation |
| 3 | Antelope Solar Project | Solar | 3.5 GW (DC) | California | NextEra Energy |
| 4 | Alta Wind Farms | Wind | 1.3 GW | California | PacifiCorp & Berkshire Hathaway Energy |
| 5 | Fowler Ridge Wind Farm | Wind | 1.26 GW | Indiana | EDP Renewables |
| 6 | Sapphire Wind Farm | Wind | 1.22 GW | Wyoming | PacifiCorp & Berkshire Hathaway Energy |
| 7 | Coronation Solar Project | Solar | 1.2 GW (AC) | New Mexico | Enel Green Power |
| 8 | Desert Sunlight Solar Farm | Solar | 550 MW (AC) | California | First Solar |
| 9 | Diamond Generating Station (Unit 3) | Natural Gas with Carbon Capture & Storage | 0.53 GW (net) | Oklahoma | NET Power & Fluor Corporation |
| 10 | Topaz Solar Farm | Solar | 550 MW (AC) | California | SunPower & Google |
Notes:
- This list includes both operational and under-construction projects.
- Capacity is measured in either gigawatts (GW) or megawatts (MW). DC (direct current) and AC (alternating current) capacities are specified where relevant.
- "Natural Gas with Carbon Capture & Storage" is still technically considered a fossil fuel source, but included here due to its potential for reducing greenhouse gas emissions.
Top 10 Largest Renewable Energy Companies in the United States
The renewable energy sector in the United States is rapidly growing, with many companies playing a significant role in the transition to clean energy.
Here are 10 of the largest renewable energy companies in the US, along with some of their notable projects:
1. NextEra Energy:
- Market Cap: $186.4 billion
- Focus: Wind and solar energy
- Notable projects:
- Wind: Grady County Wind Farm (Texas, 815 MW), Summit Ridge Wind Farm (Iowa, 540 MW)
- Solar: Manatee Solar Energy Center (Florida, 700 MW), Voyager Solar Project (California, 500 MW)
2. Brookfield Renewable Partners:
- Market Cap: $70.6 billion
- Focus: Hydropower, wind, solar, and battery storage
- Notable projects:
- Hydropower: Grand River Hydro Facility (Michigan, 1,000 MW)
- Wind: Jericho Wind Farm (Texas, 213 MW), Shannon Ridge Wind Farm (Iowa, 175 MW)
- Solar: Maricopa Solar Project (California, 400 MW)
3. Ørsted:
- Market Cap: $49.8 billion
- Focus: Offshore wind energy
- Notable projects:
- Offshore wind: Block Island Wind Farm (Rhode Island, 30 MW), Hornsea Project 2 (UK, 1.386 GW)
4. Duke Energy:
- Market Cap: $69.8 billion
- Focus: Diversified energy company with significant renewable energy investments
- Notable projects:
- Solar: Hamilton Solar PV Facility (North Carolina, 80 MW), Buckeye Solar Facility (Arizona, 100 MW)
- Wind: Atlantic Coast Offshore Wind Farm (North Carolina, 2.5 GW)
5. Dominion Energy:
- Market Cap: $60.4 billion
- Focus: Diversified energy company with significant renewable energy investments
- Notable projects:
- Solar: Coastal Virginia Solar Project (Virginia, 170 MW), Mount Sterling Solar Facility (Kentucky, 130 MW)
- Offshore wind: Coastal Virginia Offshore Wind (Virginia, 2.6 GW)
6. Constellation Energy:
- Market Cap: $22.4 billion
- Focus: Regulated utility with investments in renewable energy generation
- Notable projects:
- Solar: Beryl Solar Project (Utah, 200 MW)
- Wind: Wild Horse Solar Facility (Nevada, 500 MW)
7. EDP Renewables North America:
- Market Cap: N/A (subsidiary of EDP Renewables)
- Focus: Wind and solar energy
- Notable projects:
- Wind: Fowler Ridge Wind Farm (Indiana, 600 MW)
- Solar: Agua Caliente Solar Project (Arizona, 290 MW)
8. Invenergy:
- Market Cap: N/A (private company)
- Focus: Wind and solar energy
- Notable projects:
- Wind: Capricorn Ridge Wind Farm (Texas, 460 MW)
- Solar: Mojave Solar Project (California, 500 MW)
9. Apex Clean Energy:
- Market Cap: N/A (private company)
- Focus: Wind and solar energy
- Notable projects:
- Wind: Atlantic Sunrise Wind Farm (Virginia, 600 MW)
- Solar: Blue Mountain Solar Farm (Utah, 130 MW)
10. Avangrid Renewables:
- Market Cap: N/A (subsidiary of Avangrid)
- Focus: Wind and solar energy
- Notable projects:
- Wind: Weaver Wind Project (Wyoming, 243 MW)
- Solar: Castle Solar Project (California, 267 MW)
This list is not exhaustive, and there are many other important renewable energy companies in the United States. However, it provides a good overview of some of the leading players in the industry and their current projects.
Latest Renewable Energy Tech in the US: A Data-Driven Look
The US renewable energy landscape is buzzing with advancements across various sources and storage solutions. Here's a data-driven snapshot of some key developments:
Solar:
- Perovskite solar cells: Boasting cheaper production and exceeding 25% efficiency (compared to traditional silicon's 20%), these next-gen cells could revolutionize the industry.
- Building-integrated photovoltaics (BIPV): This aesthetically pleasing tech integrates solar panels directly into buildings, reducing costs and offering seamless integration.
Wind:
- Offshore wind: Vast untapped resources are propelling large-scale projects, offering stronger and more consistent wind energy.
- Floating wind turbines: Expanding possibilities by allowing deployment in deeper waters, particularly along the West Coast.
Energy storage:
- Long-duration storage: Technologies like flow batteries and compressed air are crucial for integrating renewables into the grid, offering days or even weeks of storage capacity.
- Battery advancements: Continuously decreasing costs and emerging chemistries like lithium-sulfur batteries promise even higher energy storage potential.
Other technologies:
- Geothermal energy: New methods for extracting energy from lower-temperature resources aim to unlock more of this clean and reliable source.
- Hydrogen: Produced from renewables, hydrogen offers storage, electricity generation, and vehicle fuel potential, but cost and infrastructure hurdles remain.
Data highlights:
- In 2022, annual US renewable energy generation surpassed coal for the first time.
- Domestic solar energy is expected to rise by 75% and wind by 11% by 2025.
- The Energy Department invests heavily in driving down the cost of solar energy in America.
These are just a few examples of the dynamic renewable energy landscape in the US. As costs continue to fall and technologies further mature, we can expect even more exciting breakthroughs in the future, paving the way for a cleaner and more sustainable energy future.
Future of Renewable Energy Development in United States
The future of renewable energy development in the United States appears bright, driven by several key factors:
Growing Demand:
- Public and corporate demand for clean energy is surging, fueled by climate change concerns and economic benefits.
- Net-zero targets set by governments and corporations further accelerate the shift towards renewables.
Technological Advancements:
- Continued cost reductions in solar, wind, and other renewables make them increasingly competitive with fossil fuels.
- Innovations in areas like grid integration, energy storage, and emerging technologies like geothermal and hydrogen unlock new possibilities.
Policy and Investment:
- The Biden administration's ambitious goals and infrastructure investments prioritize renewable energy development.
- States are enacting clean energy mandates and providing incentives, creating a supportive policy environment.
- Continued private sector investment fuels innovation and project development.
Challenges and Opportunities:
- Transmission grid upgrades are crucial to connect renewable energy sources to demand centers.
- Permitting processes and community concerns require streamlining and transparent solutions.
- Ensuring a just transition for workers in the fossil fuel industry is vital for social acceptance.
Potential Future Trajectory:
- Experts predict continued exponential growth in renewable energy capacity, potentially reaching 80% of the US electricity mix by 2050.
- Decentralized renewables like rooftop solar and community microgrids could play a significant role.
- Hybrid energy systems combining renewables with other sources like natural gas may be utilized for grid stability.
- The US has the potential to become a global leader in clean energy technology and export innovation.
Here are some additional data points to consider:
- In 2023, renewable energy accounted for 22% of US electricity generation, with solar and wind leading the way.
- The Energy Information Administration projects renewables to be the fastest-growing source of electricity generation in the coming decades.
- The renewable energy sector already employs millions of Americans, and these numbers are expected to grow significantly.
The future of renewable energy development in the US is promising, with potential for significant economic and environmental benefits. However, overcoming challenges and maximizing opportunities will require continued policy support, technological advancements, and community engagement.


