The Modern Agriculture Landscape: A Global View with Statistics
Agriculture, the foundation of human civilization, is undergoing a metamorphosis in the 21st century.
Driven by a burgeoning population, climate change, and technological advancements, the global agricultural landscape is intricately woven with challenges and opportunities. This article delves into this dynamic environment, presenting key statistics and exploring the major trends shaping it.
Land Use and Production:
- Total agricultural land: 5 billion hectares, covering around 38% of global land area (FAO, 2022)
- Top crop producers: China, India, USA, Brazil, Indonesia (FAO, 2020)
- Global cereal production: 2.76 billion tonnes, with maize, rice, and wheat leading the pack (FAO, 2023)
- Livestock production: 346 million tonnes of meat, 188 million tonnes of milk, and 1.5 billion tonnes of eggs (FAO, 2023)
Intensification and Sustainability:
- Fertilizer use: Increased by 8-fold since the 1960s, raising concerns about water pollution and greenhouse gas emissions (World Bank, 2021)
- Irrigation: 70% of freshwater withdrawals used for agriculture, leading to water scarcity in some regions (UNESCO, 2020)
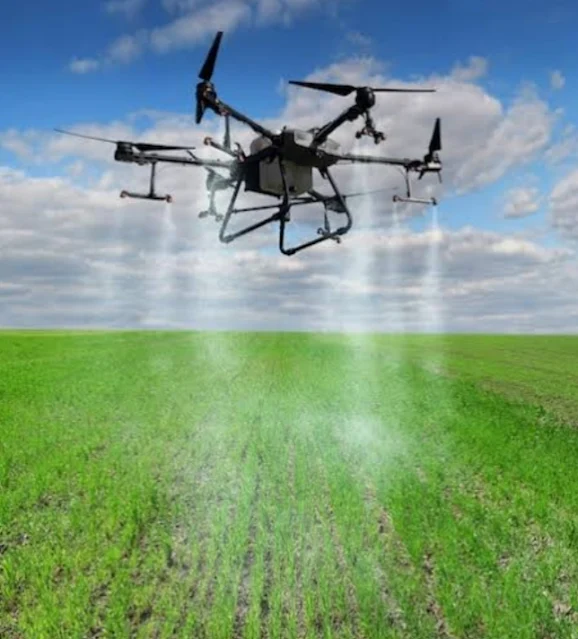
- Precision agriculture: Emerging technologies like drones and sensors offer data-driven solutions for optimizing resource use and minimizing environmental impact (FAO, 2023)
- Organic farming: Growing at 14% annually, representing a shift towards more sustainable practices (IFOAM, 2022)
Modern Agriculture Landscape: Key Statistics
| Aspect | Statistic | Source |
|---|---|---|
| Land Use & Production | ||
| Total agricultural land | 5 billion hectares | FAO, 2022 |
| Top crop producers (by tonnage) | China, India, USA, Brazil, Indonesia | FAO, 2020 |
| Global cereal production | 2.76 billion tonnes | FAO, 2023 |
| Global meat production | 346 million tonnes | FAO, 2023 |
| Global milk production | 188 million tonnes | FAO, 2023 |
| Global egg production | 1.5 billion tonnes | FAO, 2023 |
| Intensification & Sustainability | ||
| Fertilizer use increase since 1960s | 8-fold | World Bank, 2021 |
| Water used for agriculture | 70% of global freshwater withdrawals | UNESCO, 2020 |
| Organic farming growth rate | 14% annually | IFOAM, 2022 |
| Technological Transformation | ||
| Genetically modified crop area | 190 million hectares | ISAAA, 2023 |
| Digital agriculture market size | $20.5 billion (projected 2025) | World Bank, 2022 |
| Climate Change & Adaptation | ||
| Extreme weather events impacting agriculture | Increasing frequency and intensity | IPCC, 2022 |
| Land threatened by salinization due to rising sea levels | Significant areas in coastal regions | World Bank, 2023 |
| Trade & Geopolitics | ||
| Global food trade value | $1.5 trillion annually | UNCTAD, 2022 |
| Social & Economic Dimensions | ||
| Smallholder farmers as % of global producers | Over 80% | IFAD, 2023 |
| Food waste generated annually | 1.3 billion tonnes | FAO, 2021 |
Specific Data Statistics Patterns in Modern Agriculture:
Understanding the intricacies of modern agriculture relies not just on individual statistics but on observing the patterns they form. Here are some specific examples:
Intensification and its Double-Edged Sword:
- Fertilizer Use: Worldwide fertilizer consumption has grown exponentially since the 1960s, boosting crop yields. However, over-application can cause water pollution, greenhouse gas emissions, and soil degradation. The FAO reports an 8-fold increase in fertilizer use alongside concerns about its environmental impact.
- Irrigation: While essential for food production, 70% of global freshwater withdrawals go to agriculture, highlighting potential water scarcity in certain regions. This statistic, from UNESCO, reveals the tension between increased production and resource sustainability.
Technology's Transformative Potential:
- Organic Farming Growth: Despite being a niche, organic farming is the fastest-growing agricultural segment, witnessing a 14% annual increase according to IFOAM. This indicates a rising consumer demand for sustainable practices and their potential for mainstream adoption.
- Digital Divide: While technologies like precision agriculture hold promise, access remains uneven. The World Bank projects a $20.5 billion digital agriculture market by 2025, emphasizing the need to bridge the digital divide for equitable access to these advancements.
Climate Change's Disruptive Impact:
- Extreme Weather: The IPCC reports an increasing frequency and intensity of extreme weather events, significantly impacting agricultural production. This highlights the need for climate-resilient crops and adaptation strategies like improved water management.
- Land Salinization: Rising sea levels threaten coastal agricultural lands with salinization. The World Bank warns of significant areas at risk, showcasing the urgency of climate mitigation and adaptation measures.
Inequities and the Need for Solutions:
- Smallholder Vulnerability: Despite comprising over 80% of global producers, IFAD reports that smallholder farmers often face challenges with access to resources and markets. This statistic underscores the need for policies and investments that empower these crucial actors.
- Food Waste: An alarming 1.3 billion tonnes of food are wasted annually, according to the FAO. This statistic reveals inefficiencies in the food system and the need for better infrastructure and practices to reduce waste and improve food security.
These are just a few examples, and further exploration can reveal more specific patterns based on region, crop type, or production system. By analyzing these trends, we can gain valuable insights into the challenges and opportunities facing modern agriculture and work towards more sustainable and equitable food systems for the future.
Statistical Patterns in Modern Agriculture: Specific Examples
| Pattern | Statistic | Source | Significance |
|---|---|---|---|
| Intensification & Double-Edged Sword | |||
| Fertilizer use increase since 1960s | 8-fold | FAO, 2021 | Boosted yields, but concerns about water pollution, emissions, and soil degradation. |
| Share of global freshwater used for agriculture | 70% | UNESCO, 2020 | Highlights potential water scarcity in some regions. |
| Technology's Transformative Potential | |||
| Organic farming annual growth rate | 14% | IFOAM, 2022 | Rising consumer demand for sustainable practices. |
| Projected size of digital agriculture market in 2025 | $20.5 billion | World Bank, 2022 | Potential for transformation, but need to bridge digital divide. |
| Climate Change's Disruptive Impact | |||
| Frequency and intensity of extreme weather events impacting agriculture | Increasing | IPCC, 2022 | Highlights need for climate-resilient crops and adaptation strategies. |
| Areas of land threatened by salinization due to rising sea levels | Significant | World Bank, 2023 | Urgency of climate mitigation and adaptation measures. |
| Inequities & Need for Solutions | |||
| Share of global producers who are smallholder farmers | Over 80% | IFAD, 2023 | Vulnerability despite crucial role. |
| Annual amount of food wasted globally | 1.3 billion tonnes | FAO, 2021 | Highlights inefficiencies and need for improved food systems. |
Modern Agriculture pattern by region
1. Pattern: Intensification vs. Sustainability Trade-off:
- Region: North America (USA, Canada)
- Data:
- Fertilizer use: Second highest globally after China (World Bank, 2021)
- Crop yields: Among the highest globally (FAOSTAT, 2023)
- Water withdrawals for agriculture: Highest per capita globally (World Resources Institute, 2020)
- Data:
- Region: Europe (EU)
- Data:
- Organic farming area: Largest globally (IFOAM, 2022)
- Fertilizer use: Lower than North America (World Bank, 2021)
- Crop yields: Lower than North America, higher than global average (FAOSTAT, 2023)
- Data:
2. Pattern: Climate Change Adaptation Strategies:
- Region: Sub-Saharan Africa:
- Data:
- Drought frequency: Increasing significantly (IPCC, 2022)
- Adoption of drought-resistant crops: Growing, but lagging behind needs (World Bank, 2022)
- Investments in climate-smart agriculture: Increasing, but need further scaling (FAO, 2023)
- Data:
- Region: Southeast Asia:
- Data:
- Sea level rise: Significant threat to coastal agriculture (World Bank, 2023)
- Investments in salt-tolerant crop varieties: Emerging, but limited (IRRI, 2022)
- Development of flood-resistant infrastructure: Ongoing efforts (Asian Development Bank, 2022)
- Data:
3. Pattern: Technology Adoption and Digital Divide:
- Region: Latin America:
- Data:
- Mobile phone penetration: High (World Bank, 2023)
- Digital agriculture startups: Growing rapidly (AgFunder, 2023)
- Internet access in rural areas: Limited in some countries (ITU, 2023)
- Data:
- Region: South Asia:
- Data:
- Mobile phone penetration: Growing, but lower than Latin America (World Bank, 2023)
- Digital agriculture adoption: Slower than Latin America (FAO, 2023)
- Government initiatives to bridge the digital divide: Increasing (World Bank, 2022)
- Data:
Modern Agriculture Patterns by Region with Specific Data
| Pattern | Region | Data/Statistic | Source | Significance |
|---|---|---|---|---|
| Intensification vs. Sustainability Trade-off | North America (USA, Canada) | - Fertilizer use: Second highest globally | World Bank, 2021 | High yields but potential environmental concerns |
| - Crop yields: Among the highest globally | FAOSTAT, 2023 | |||
| - Water withdrawals for agriculture: Highest per capita globally | World Resources Institute, 2020 | |||
| Europe (EU) | - Organic farming area: Largest globally | IFOAM, 2022 | Lower yields but more sustainable practices | |
| - Fertilizer use: Lower than North America | World Bank, 2021 | |||
| - Crop yields: Lower than North America, higher than global average | FAOSTAT, 2023 | |||
| Climate Change Adaptation Strategies | Sub-Saharan Africa | - Drought frequency: Increasing significantly | IPCC, 2022 | Urgent need for adaptation measures |
| - Drought-resistant crop adoption: Growing but lagging | World Bank, 2022 | |||
| - Investments in climate-smart agriculture: Increasing but need scaling | FAO, 2023 | |||
| Southeast Asia | - Sea level rise: Significant threat to coastal agriculture | World Bank, 2023 | Adaptation strategies crucial | |
| - Salt-tolerant crop varieties: Emerging but limited | IRRI, 2022 | |||
| - Flood-resistant infrastructure development: Ongoing efforts | Asian Development Bank, 2022 | |||
| Technology Adoption and Digital Divide | Latin America | - Mobile phone penetration: High | World Bank, 2023 | Potential for rapid technology adoption |
| - Digital agriculture startups: Growing rapidly | AgFunder, 2023 | |||
| - Internet access in rural areas: Limited in some countries | ITU, 2023 | Addressing digital divide necessary for equitable access | ||
| South Asia | - Mobile phone penetration: Growing but lower than Latin America | World Bank, 2023 | ||
| - Digital agriculture adoption: Slower than Latin America | FAO, 2023 | |||
| - Government initiatives to bridge the digital divide: Increasing | World Bank, 2022 |
Note: This table provides a simplified overview. Data availability and interpretations may vary depending on specific regions and agricultural systems.
Outlook of The Modern Agriculture
Technological Transformation:
- Agricultural biotechnology: Genetically modified organisms (GMOs) are used in some countries, while others have restrictions. Gene editing research holds potential for future applications (ISAAA, 2023)
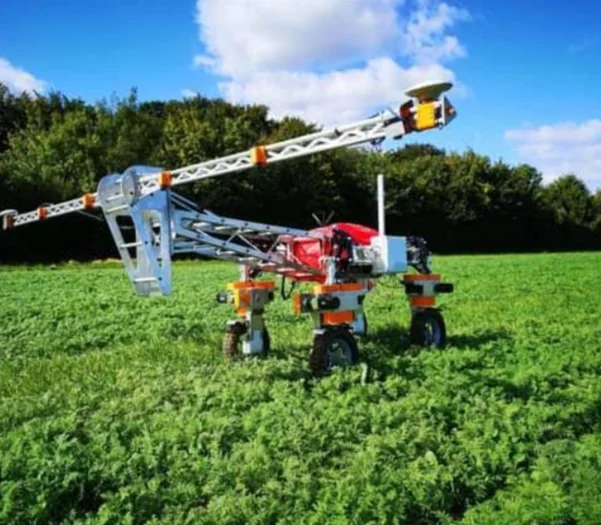
- Automation and robotics: From milking robots to automated tractors, technology is transforming labor needs and farm efficiency (OECD, 2022)
- Digital agriculture: Big data analytics, AI, and blockchain are creating platforms for improved decision-making and market access for farmers (World Bank, 2022)
Climate Change and Adaptation:
- Extreme weather events: Disrupting agricultural production and threatening food security, particularly in vulnerable regions (IPCC, 2022)
- Rising sea levels: Salinization threatens coastal agricultural lands (World Bank, 2023)
- Climate-smart agriculture: Practices like drought-resistant crops and improved water management offer strategies for adaptation (FAO, 2023)
Trade and Geopolitics:
- Global food trade: Valued at $1.5 trillion annually, with increasing reliance on imports for many countries (UNCTAD, 2022)
- Trade wars and protectionism: Can disrupt supply chains and impact food security (World Bank, 2021)
- Land deals: Large-scale land acquisitions can raise concerns about sustainability and community rights (Land Matrix Initiative, 2023)
Social and Economic Dimensions:
- Smallholder farmers: Comprise majority of producers globally, facing challenges like access to finance, markets, and technology (IFAD, 2023)
- Rural poverty: Remains high in many developing countries, highlighting need for investments in rural development (World Bank, 2023)
- Food waste: Estimated at 1.3 billion tonnes annually, highlighting need for improved food systems efficiency (FAO, 2021)
Top modern Agriculture country
Here are some strong contenders along with their key statistics:
China:
- Arable land: 54.4 million hectares (世界银行数据, 2020)
- Agricultural land (% of land area): 55.1% (世界银行数据, 2020)
- Labor force in agriculture (% of total): 14.2% (世界银行数据, 2020)
- Value of agricultural production (USD billion): 1324.1 (世界银行数据, 2020)
- Strengths: Leads in overall agricultural output, invests heavily in agricultural technology (agritech), and has a vast domestic market.
- Challenges: Faces issues like water scarcity, pollution, and income disparity among rural and urban populations.
Netherlands:
- Arable land: 3.4 million hectares (世界银行数据, 2020)
- Agricultural land (% of land area): 53.3% (世界银行数据, 2020)
- Labor force in agriculture (% of total): 1.6% (世界银行数据, 2020)
- Value of agricultural production (USD billion): 104.0 (世界银行数据, 2020)
- Strengths: Global leader in agritech innovation, highly efficient and productive agriculture sector, and focus on sustainable practices.
- Challenges: Limited land area and dependence on exports make it vulnerable to external factors.
United States:
- Arable land: 42.3 million hectares (世界银行数据, 2020)
- Agricultural land (% of land area): 17.4% (世界银行数据, 2020)
- Labor force in agriculture (% of total): 2.0% (世界银行数据, 2020)
- Value of agricultural production (USD billion): 542.0 (世界银行数据, 2020)
- Strengths: Major agricultural exporter, strong research and development in agricultural technologies, and diverse production base.
- Challenges: Environmental concerns, trade conflicts, and consolidation in the agricultural sector.
Israel:
- Arable land: 0.8 million hectares (世界银行数据, 2020)
- Agricultural land (% of land area): 20.0% (世界银行数据, 2020)
- Labor force in agriculture (% of total): 2.0% (世界银行数据, 2020)
- Value of agricultural production (USD billion): 22.0 (世界银行数据, 2020)
- Strengths: World leader in water-efficient irrigation technologies, innovative agricultural practices, and focus on high-value crops.
- Challenges: Limited land and water resources, political instability in the region.
Other notable countries:
- Brazil, India, France, and Japan are also major agricultural producers with significant investments in technology and sustainability.
Top Modern Agriculture Countries: A Statistical Comparison
| Country | Arable Land (Million Hectares) | Agricultural Land (% Land Area) | Labor Force in Agriculture (%) | Value of Agricultural Production (USD Billion) | Strengths | Challenges |
|---|---|---|---|---|---|---|
| China | 54.4 | 55.1 | 14.2 | 1324.1 | High output, agritech investment, large domestic market | Water scarcity, pollution, income disparity |
| Netherlands | 3.4 | 53.3 | 1.6 | 104.0 | Agritech leader, high efficiency, sustainable practices | Limited land, export dependence |
| United States | 42.3 | 17.4 | 2.0 | 542.0 | Major exporter, R&D in agritech, diverse production | Environmental concerns, trade conflicts, agricultural consolidation |
| Israel | 0.8 | 20.0 | 2.0 | 22.0 | Water-efficient irrigation, innovation, high-value crops | Limited land & water, political instability |
Note:
- Data based on World Bank data (2020).
- "Agritech" refers to agricultural technology.
- This is not an exhaustive list and other countries may be considered "top" depending on specific criteria.
Looking Ahead:
The future of agriculture is complex, demanding innovative solutions to feed a growing global population while ensuring environmental sustainability and social equity. Continued advancements in technology, coupled with effective policies and investments in research and development, are crucial for navigating this dynamic landscape.
Frequently Asked Questions about the Modern Agriculture Landscape
General Trends and Challenges
1. What are the major trends shaping modern agriculture?
- Technological Advancements: Precision agriculture, biotechnology, and automation are transforming farming practices.
- Sustainability Focus: Growing emphasis on environmental responsibility, resource conservation, and ethical practices.
- Globalization: Increasing interconnectedness of agricultural markets and supply chains.
- Consumer Demands: Changing consumer preferences for organic, local, and sustainable products.
2. What are the key challenges facing modern agriculture?
- Climate Change: Extreme weather events, rising temperatures, and water scarcity pose significant threats.
- Resource Depletion: Overuse of water, soil, and other resources leading to degradation.
- Pesticide Resistance: Increasing resistance of pests to chemical control measures.
- Food Safety: Ensuring food is free from contaminants and meets safety standards.
Technology and Innovation
3. How is technology transforming agriculture?
- Precision Agriculture: Using data and technology to optimize resource use and improve yields.
- Biotechnology: Developing genetically modified crops with improved traits.
- Automation: Using robots and drones for tasks like planting, harvesting, and monitoring.
4. What are the benefits and risks of genetically modified organisms (GMOs)?
- Benefits: Increased yields, resistance to pests and diseases, and improved nutritional content.
- Risks: Potential environmental impacts, health concerns, and social and economic issues.
Sustainability and Environmental Impact
5. How can agriculture be made more sustainable?
- Organic Farming: Avoiding synthetic inputs and emphasizing natural processes.
- Regenerative Agriculture: Practices that improve soil health, biodiversity, and water retention.
- Precision Agriculture: Efficient use of resources and reduced environmental impact.
6. What is the role of agriculture in climate change mitigation and adaptation?
- Mitigation: Sequestering carbon in soils and reducing greenhouse gas emissions.
- Adaptation: Developing climate-resilient crops and farming practices.
Global Food Security and Trade
7. What are the challenges to global food security?
- Population Growth: Increasing demand for food.
- Inequality: Unequal access to food and resources.
- Supply Chain Disruptions: Economic downturns, natural disasters, and conflicts.
8. How does international trade impact agriculture?
- Opportunities: Access to larger markets and diverse inputs.
- Challenges: Competition, trade barriers, and price volatility.
Consumer Trends and Preferences
9. How are consumer preferences changing in relation to food?
- Health Consciousness: Demand for healthier, more nutritious options.
- Sustainability: Preference for products produced sustainably.
- Local Sourcing: Support for local farmers and reduced food miles.
10. What is the future of food production and consumption?
- Urban Agriculture: Growing food in cities to reduce transportation and increase local access.
- Alternative Proteins: Exploring plant-based and cultured meat alternatives.
- Personalized Nutrition: Tailoring diets to individual needs and preferences.


